Make sure to revisit the prerequisites on the front page.
Installation
Download setup files and use pre-compiled image
Make a folder where you want to install
QC4Metabolomics.
Linux/WSL
If you are using linux/WSL, navigate to the folder you created and then run the following in a command-prompt, which will download the demo data (or download manually from github), and unzip the content:
Windows
If you are using Windows, navigate to the folder you created and then run the following in a command-prompt, which will download the demo data (or download manually from github), and unzip the content:
curl.exe -L -o QC4Metabolomics-demo.zip https://github.com/stanstrup/QC4Metabolomics/releases/latest/download/QC4Metabolomics-demo.zip
tar -xf QC4Metabolomics-demo.zip
del QC4Metabolomics-demo.zip
Now you can launch the demo:
Local compilation
This is only useful if you want to modify the software yourself. Otherwise move ahead to the next step.
Make sure to revisit the prerequisites on the front page.
First download the repository to somewhere convenient (here
/opt).
cd /opt
sudo git lfs clone https://github.com/stanstrup/QC4Metabolomics.git
cd QC4Metabolomics
sudo chmod +x ./setup/*.sh
Now you need to build the base image (used by several processes) which requires downloading many R packages and will take a while.
You can now build the final containers. This will also start the demo.
Getting started with the demo
You can now open the demo in your browser by visiting
localhost. It might take a few minutes before it can load
though, since the database needs to be initialized on first load. If the
database is not initialized yet the console will show “Error : No tables
in the DB. Probably not done initializing.”.
Once the app loads you will see that no plots appear. This is because no compounds to analyze has been defined.
First click the Contaminants tab. If no plot appears go
get a coffee and come back and reload the page (it will look for new
files every 1 min and then analyze the data). The plot is available when
the system has analyzed the demo files. Once a plot appears you can try
to change the “Minimum intensity in any sample” (for example to
103). Now you can see which are the most common
contaminants.
Track specific compounds
Now we want to make the tracking of specific analytes work. So go to
the Track compounds –> Compound settings
tab. Now we fill in the data to track Tryptophan in both modes.
These are the settings you need:
| Compound name | Instrument | Mode | m/z | RT1 |
|---|---|---|---|---|
| L-Tryptophan | Sold | pos | 188.0706 | 2.55 |
| L-Tryptophan | Sold | neg | 203.0826 | 2.55 |
Click “Submit” when you have filled the form and repeat for the second compound/mode.
When you are done it should look like this:
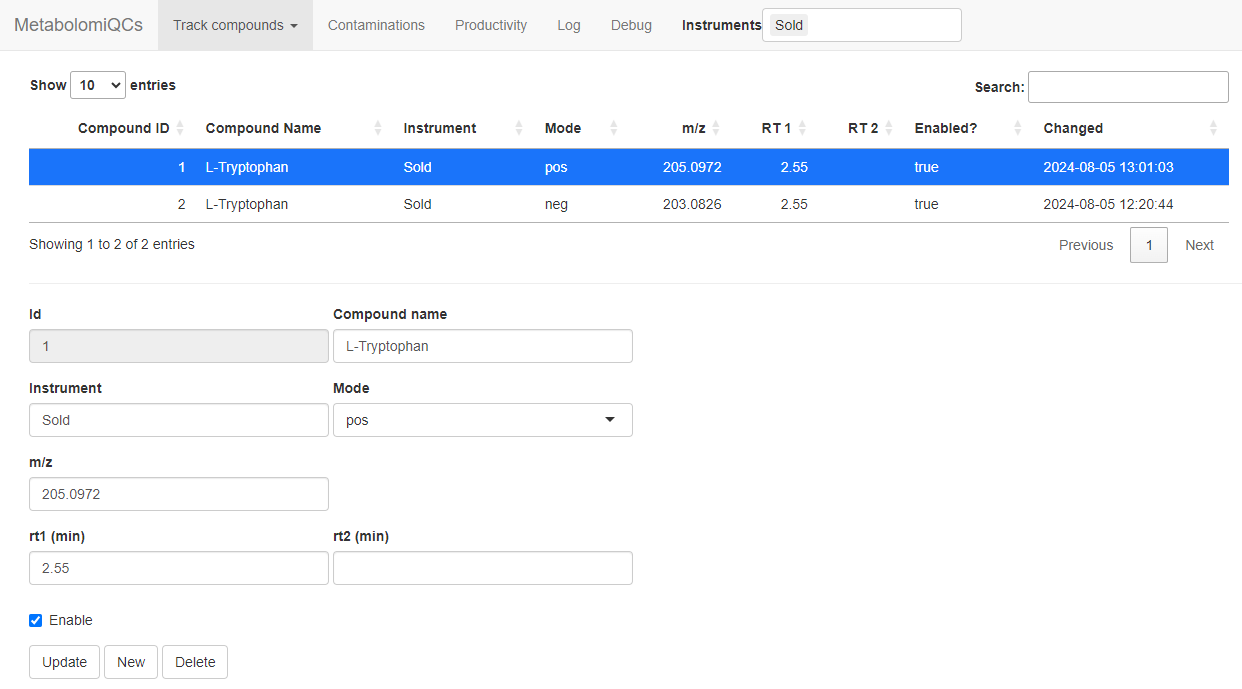
Settings to track tryptophan
After some minutes you should be able reload the browser and see the data for tryptophan in the “Track compounds” -> “Compound stats” tab.
Enabling email warnings
By default the e-mail warnings are off, since you need to supply your
own email server settings to send e-mails.
You can use GMail or any other SMTP server to send emails. If you use
GMail you need to create an “app password”, which can be done in your
GMail account,
and not use your regular GMail password.
Once you have create your password you need to edit the settings for the
“Warner module”. You do that by opening the file
settings_demo.env and scrolling down to the section
“module: Warner”. First you enable the module by setting
QC4METABOLOMICS_module_Warner_enabled to
TRUE.
Next you need to set your credentials and server. Below is an example
where EMAIL_SENDER and YOUR_USER would be your
e-mail address for the account that sends the emails and
EMAIL_RECEIVER would be the address of the email that
should receive the emails (can be the same as the sender). The
password is the account password or in the case of GMail the “app
password”. Below are the settings needed for GMail.
QC4METABOLOMICS_module_Warner_email_from=EMAIL_SENDER
QC4METABOLOMICS_module_Warner_email_to=EMAIL_RECEIVER
QC4METABOLOMICS_module_Warner_email_user=YOUR_USER
QC4METABOLOMICS_module_Warner_email_password=YOUR_PASSWORD
QC4METABOLOMICS_module_Warner_email_host=smtp.gmail.com
QC4METABOLOMICS_module_Warner_email_port=587
QC4METABOLOMICS_module_Warner_email_use_ssl=TRUE
You should now stop QC4Metabolomics (ctrl + C) and start
it again using:
Next go to the “Warning rules” tab and setup some rules. If the page
is empty wait up to 5 mins for the database to create the new tables the
Warner modules uses.
Any file that matches any of the rules will trigger an email. The
emails are send as soon as a matching file is found, but in bulk for all
newly found files and only once per file.
The rules only apply to files from a specific
Instrument, as extracted from the filename. Next you need
to select which statistic to monitor. Usually the most relevant
statistics are the m/z deviation from the expected
(mz_dev_ppm), the retention time deviation from the
expected in minutes (rt_dev) and the apex intensity
(maxo).
You then choose the operator meaning the comparison to be
done. “Greater than” (>) would be typical. Then the
Value to compare the statistic to needs to be chosen and
finally it should be decided if the absolute value of the
Value is to be considered instead of the raw (signed)
value.
To check the system with the demo you could try these settings that will
trigger on all files where the m/z deviation is more than 30
ppm.
| Rule Name | Instrument | Statistics | Operator | Value | Use absolute value? |
|---|---|---|---|---|---|
| PPM out of range | Sold | mz_dev_ppm | > | 30 | TRUE |
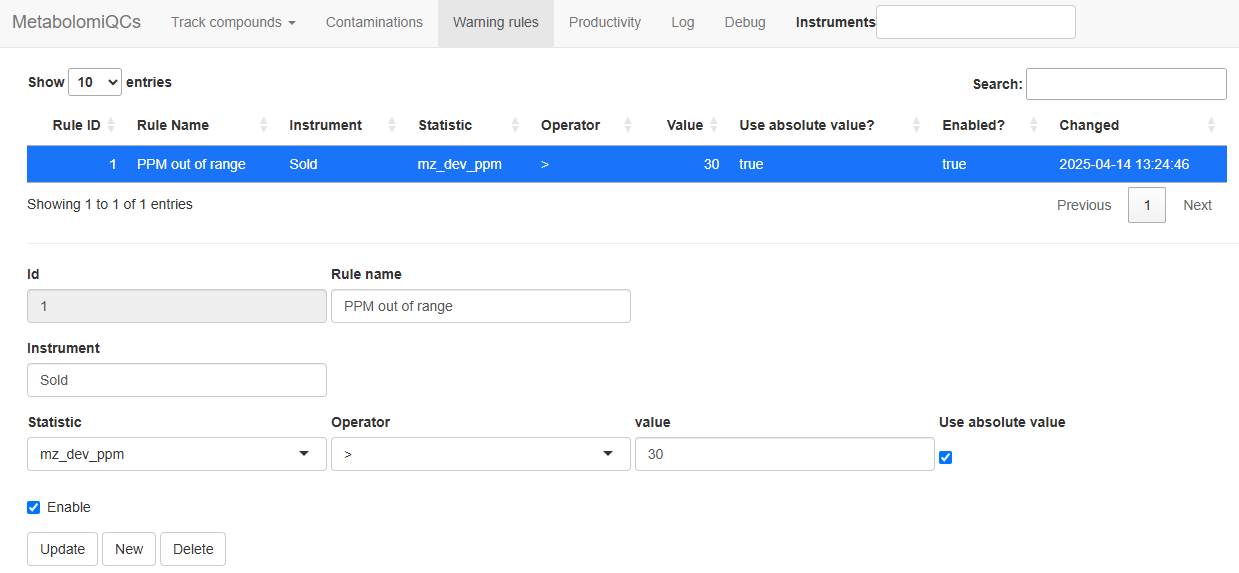
Settings to trigger warnings