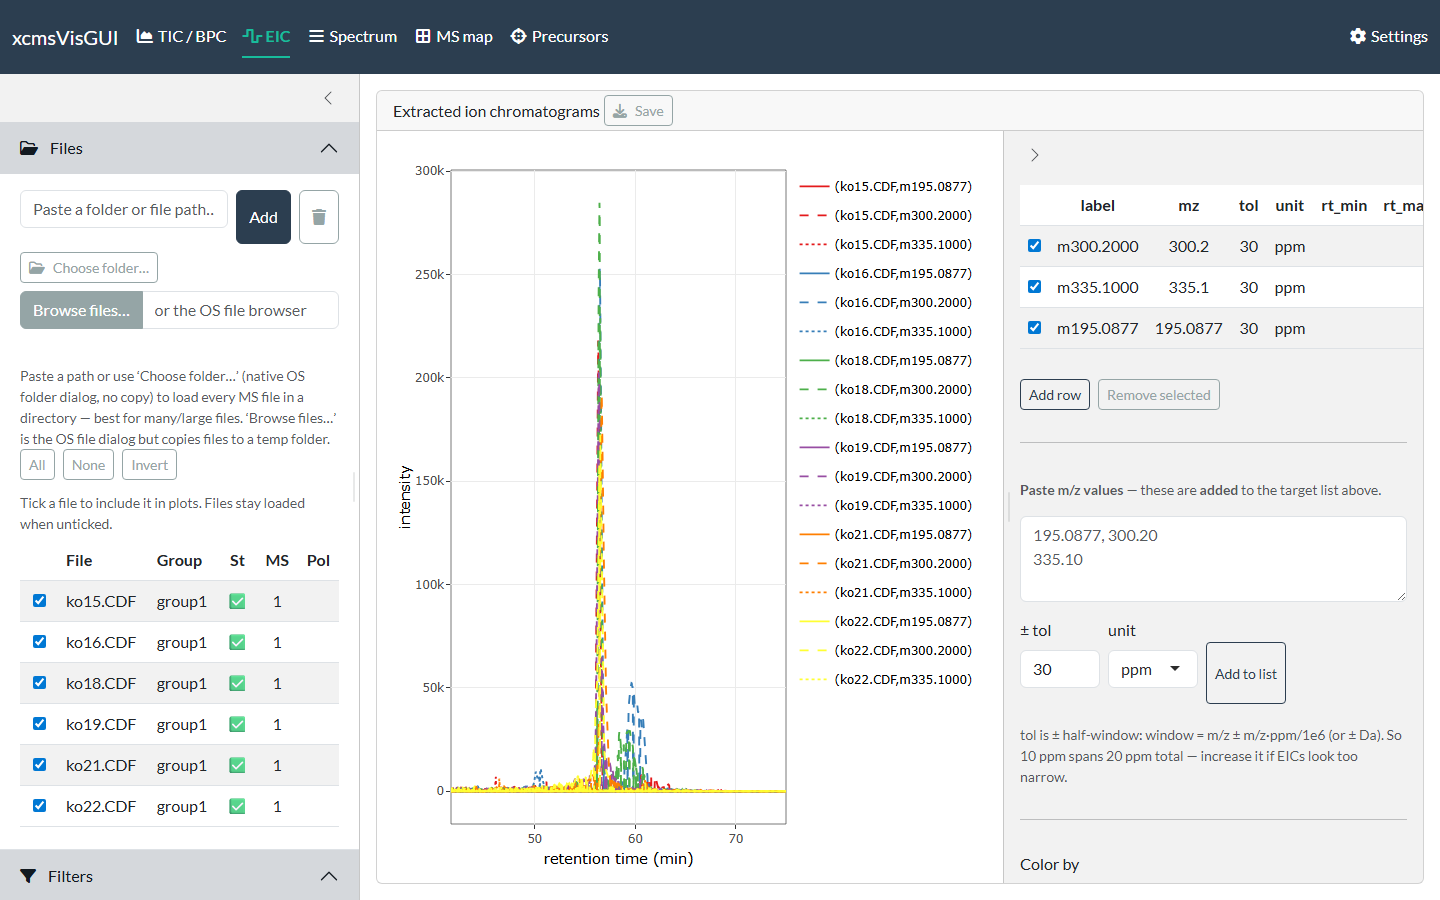
The EIC tab extracts one or more m/z windows across the included files and overlays the traces. A target table in the sidebar drives the extraction.
Building the target list
There are three ways to add targets — they all append to the same table:
- Click peaks in the Spectrum tab. Clicking a peak on the Spectrum view adds its m/z to this list (its default click action). This is the usual workflow: open a spectrum, click the ions you care about, then come here to see their chromatograms.
- Paste m/z values. Paste a comma/newline-separated list into the box and click Add to list; the tolerance/unit next to it seed the new rows.
- Add a blank row with Add row and type the m/z in.
Each row is editable: label, m/z, tol, unit (ppm or Da), and an optional rt window. The tolerance is a ± half-window, so 10 ppm spans 20 ppm total — widen it if traces look too narrow. Untick a row’s checkbox to drop it from the plot without deleting it; Remove selected deletes rows. The default tolerance/unit for new targets come from Settings.
Display
- Color by — File, Target, or Sample group. When not colouring by target, multiple targets are distinguished by line type.
- Show data points — overlay scan points.
- Facet by file — one panel per file instead of a single overlay.
The global Filters (MS level, intensity, …) apply to the extraction.
Moving between tabs
Click any EIC trace to send that file and retention time to the Spectrum tab, then switch to it to read the spectrum at that point — handy for confirming a co-eluting ion or checking peak purity.