The MS map plots a 2-D m/z × retention-time view of the included files. It draws exact centroids (no binning) with an mzMine-style contrast control — lower the contrast to reveal weaker peaks.
This view is gated: press Plot to render, so it never auto-extracts every file as you change unrelated settings.
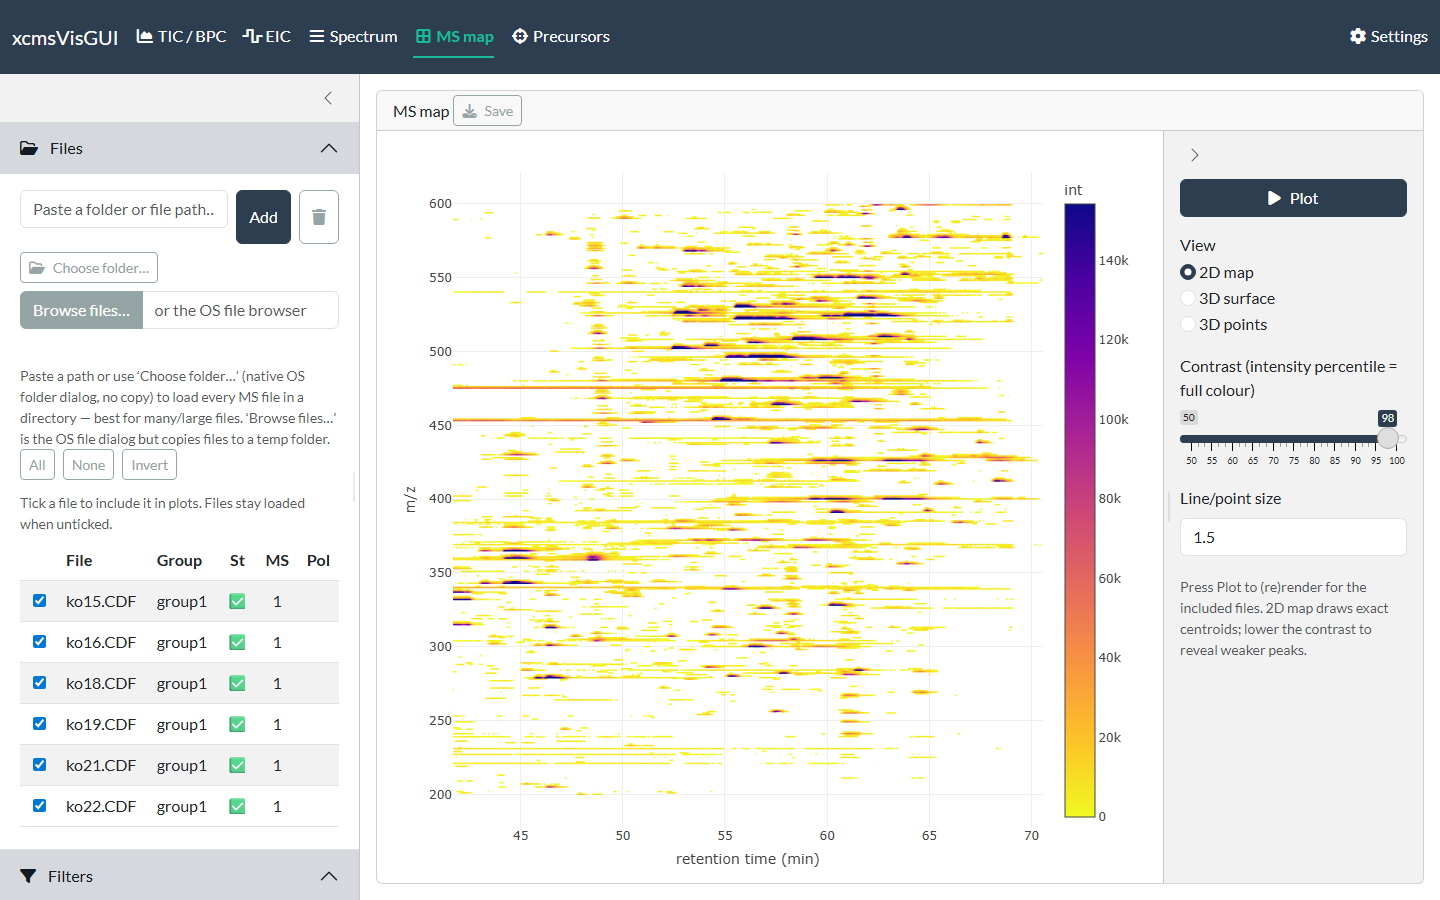
2-D MS map
3D views
Switch the view to 3D surface or 3D points for a binned surface / scatter you can rotate. The bin sizes (and, for points, an intensity cutoff) are set in the sidebar.
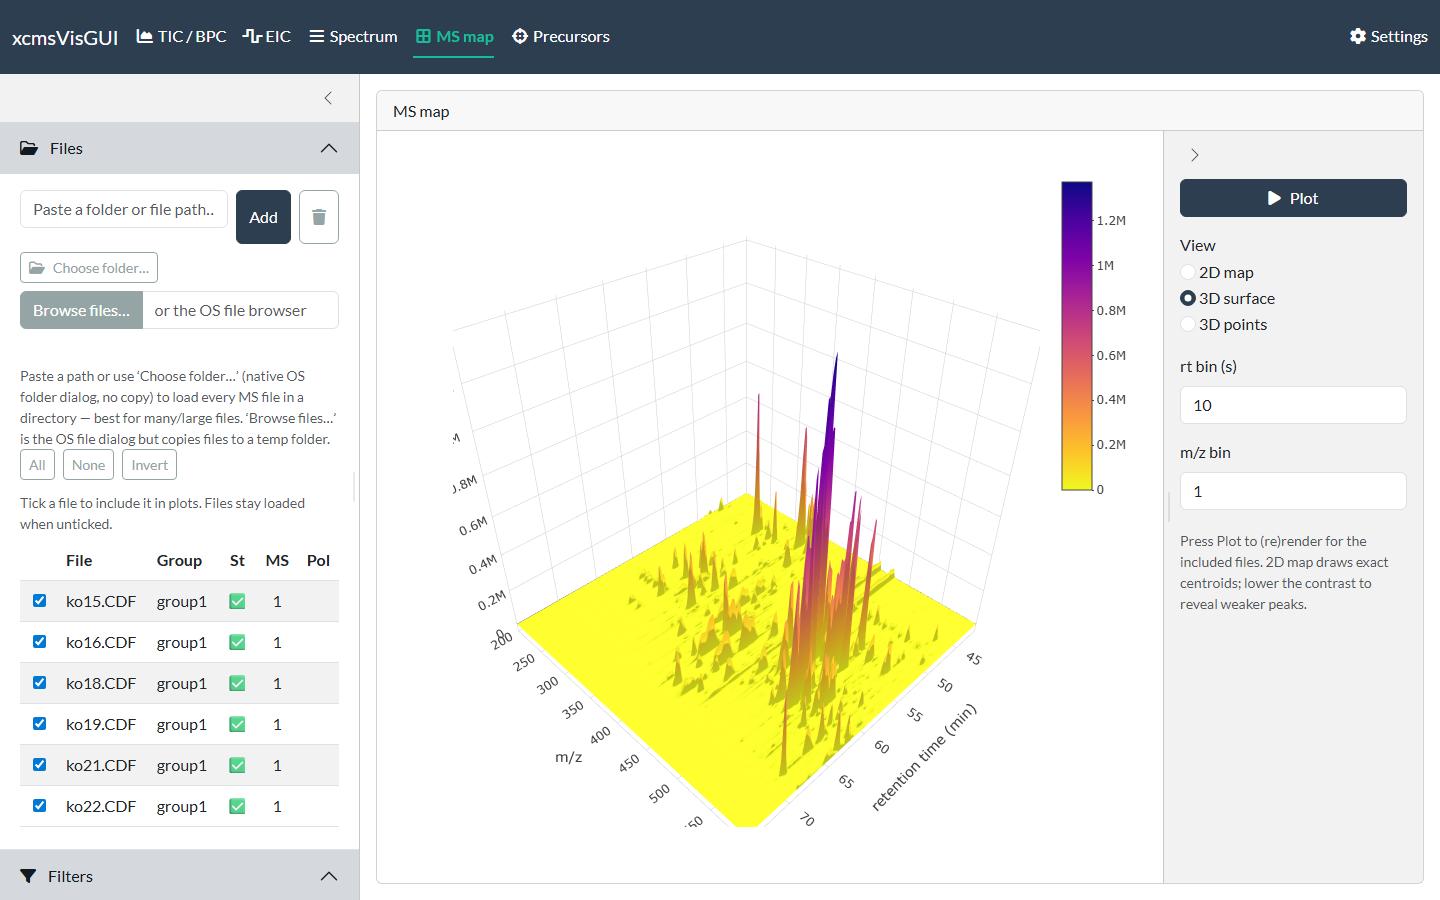
3-D surface
Moving between tabs
Click a pixel on the 2-D map to send that retention time to the Spectrum tab (for the first included file); switch to the Spectrum tab to read the full scan there. It’s a fast way to go from “there’s a spot here” to the actual mass spectrum.