The first tab overlays the total-ion (sum) or base-peak (max) chromatogram of every included file. It renders as soon as one file is included, and re-extracts only when the included file set or the global filters change.
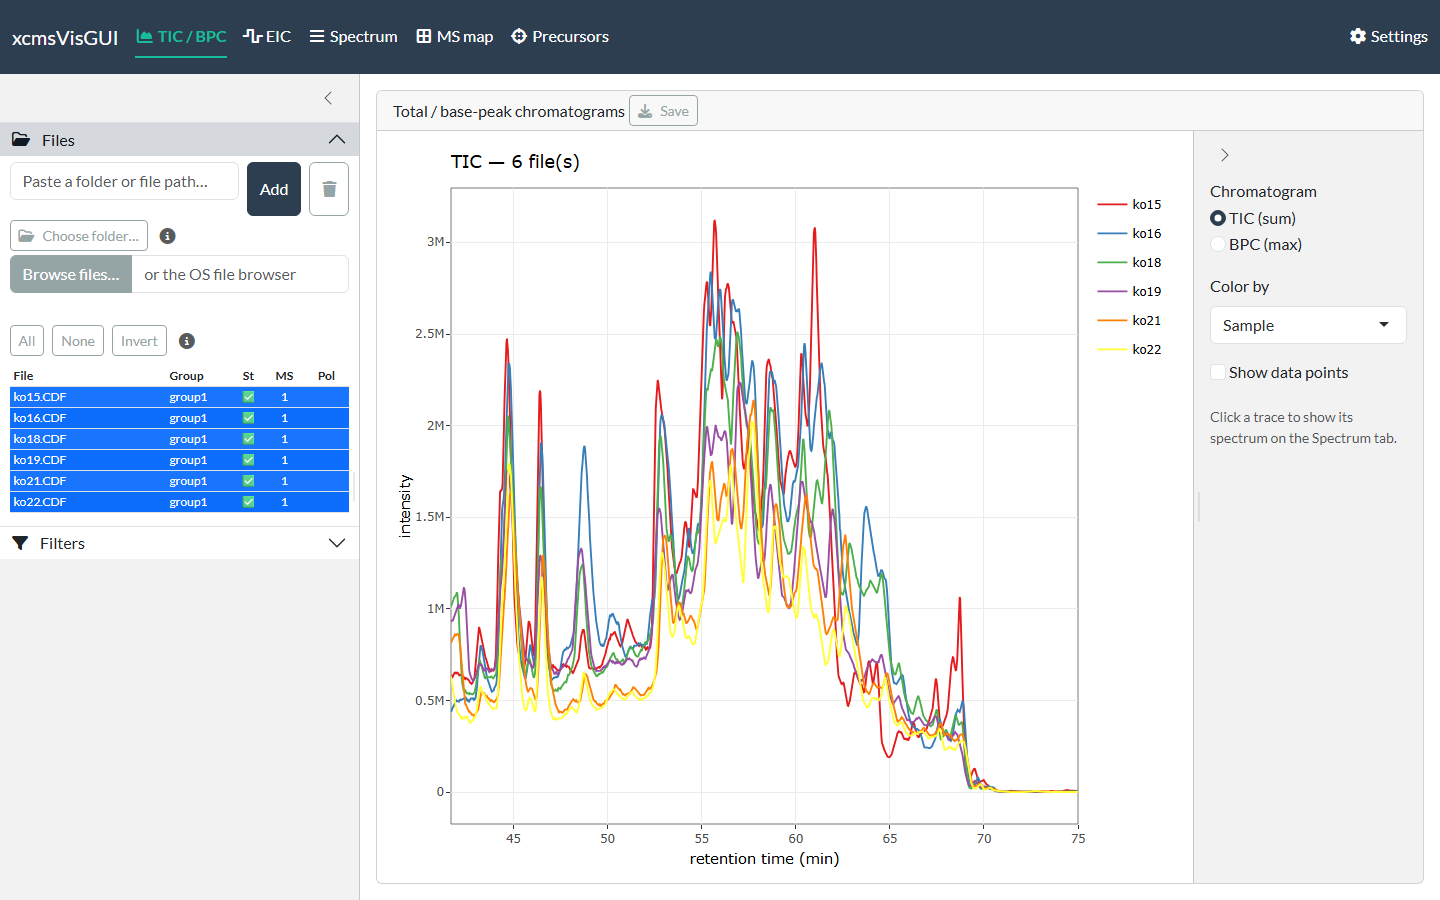
The TIC overlay across included files
Controls
- TIC (sum) / BPC (max) — total-ion vs. base-peak chromatogram.
- Color by — Sample (one colour per file) or Sample group (the Group column in the file list). Colours are ColorBrewer qualitative.
- Show data points — overlay the individual scan points on the lines.
Retention time uses the display unit set in Settings, and the MS level / intensity / spectrum-ID filters from the Filters panel apply here too.
Moving between tabs
Click any trace to send that file and retention time to the Spectrum tab; switch to the Spectrum tab to view the scan at that point. This is the quickest way to inspect “what is under this peak?” — find a feature on the TIC, click it, and read its mass spectrum.
Export
Save writes a static png/svg/pdf (or the raw ggplot
.rds) using the Settings export defaults.