ggplot2 Version of plotChromPeaks()
Source: R/AllGenerics.R, R/gplotChromPeaks-methods.R
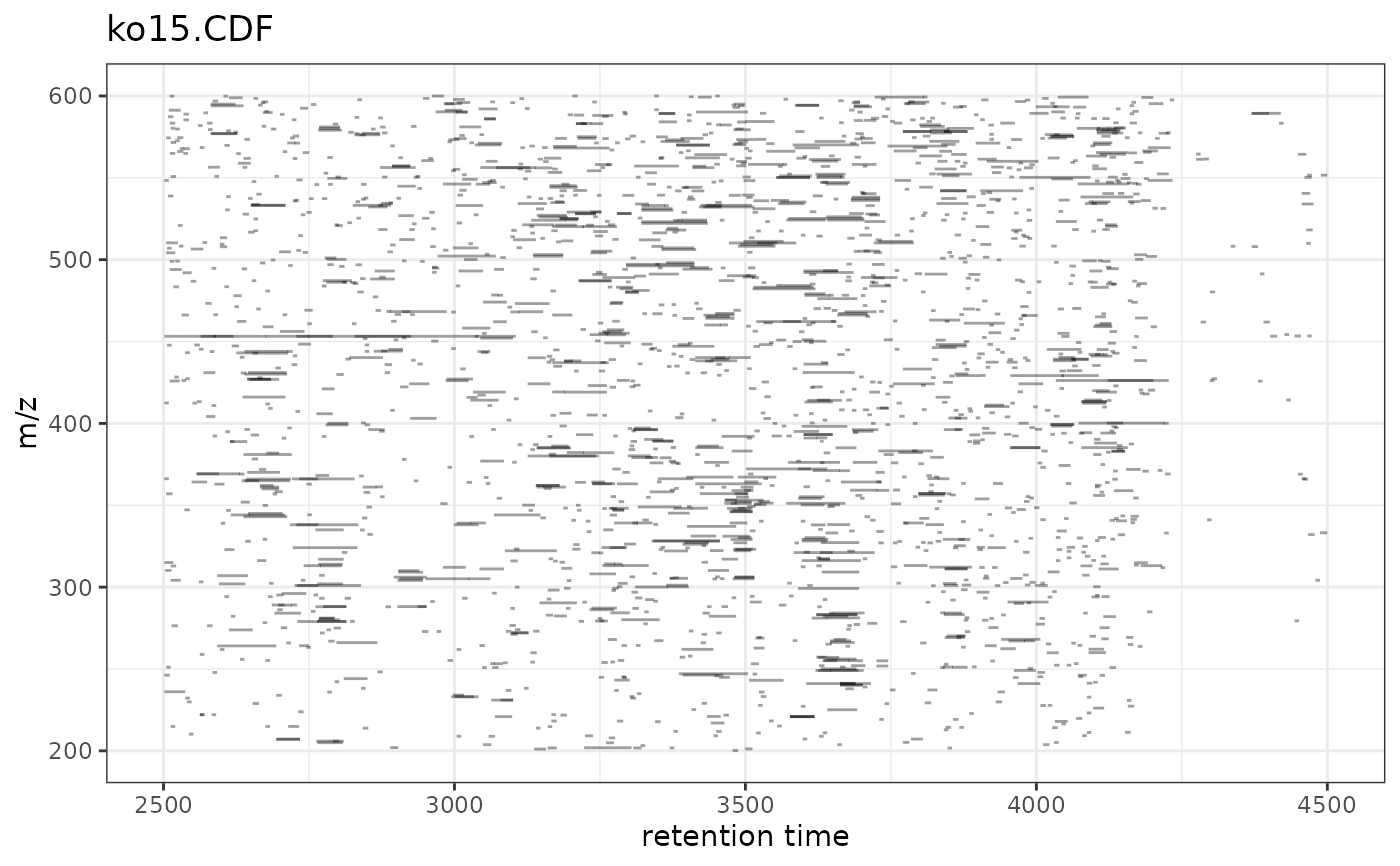
gplotChromPeaks.RdVisualizes identified chromatographic peaks as rectangles in the retention
time vs. m/z plane. This is a ggplot2 implementation of xcms's
xcms::plotChromPeaks() function, enabling modern visualization and
interactive plotting capabilities.
Usage
gplotChromPeaks(
  object,
  file = 1,
  xlim = NULL,
  ylim = NULL,
  border = "#00000060",
  fill = NA,
  msLevel = 1L
)

# S4 method for class 'XCMSnExp'
gplotChromPeaks(
  object,
  file = 1,
  xlim = NULL,
  ylim = NULL,
  border = "#00000060",
  fill = NA,
  msLevel = 1L
)

# S4 method for class 'XcmsExperiment'
gplotChromPeaks(
  object,
  file = 1,
  xlim = NULL,
  ylim = NULL,
  border = "#00000060",
  fill = NA,
  msLevel = 1L
)
Arguments
- object
An
XCMSnExporXcmsExperimentobject with detected chromatographic peaks.- file
integer(1)specifying which file/sample to plot (default: 1).- xlim
numeric(2)vector of length 2 specifying retention time range. IfNULL(default), uses full retention time range.- ylim
numeric(2)vector of length 2 specifying m/z range. IfNULL(default), uses full m/z range.- border
Color for peak rectangle borders (default: semi-transparent black).
- fill
Color for peak rectangle fills (default:
NAfor no fill).- msLevel
integer(1)specifying MS level (default: 1).
Details
The function:
Plots each peak as a rectangle spanning its rt and m/z ranges
Uses geom_rect to create the peak rectangles
Supports interactive plotting through plotly conversion
See also
xcms::plotChromPeaks() for the original xcms implementation
Examples
library(xcmsVis)
library(xcms)
library(faahKO)
library(MsExperiment)
library(BiocParallel)

# Load example data
cdf_files <- dir(system.file("cdf", package = "faahKO"),
                 recursive = TRUE, full.names = TRUE)[1:3]

# Create XcmsExperiment and perform peak detection
xdata <- readMsExperiment(spectraFiles = cdf_files, BPPARAM = SerialParam())
cwp <- CentWaveParam(peakwidth = c(20, 80), ppm = 25)
xdata <- findChromPeaks(xdata, param = cwp, BPPARAM = SerialParam())

# Create plot
p <- gplotChromPeaks(xdata, file = 1)
print(p)