ggplot2 Version of plotFeatureGroups()
Source: R/AllGenerics.R, R/gplotFeatureGroups-methods.R
gplotFeatureGroups.RdVisualizes feature groups by plotting features connected across retention
time and m/z dimensions. This is a ggplot2 implementation of xcms's
xcms::plotFeatureGroups() function, enabling modern visualization and
interactive plotting capabilities.
Usage
gplotFeatureGroups(
  x,
  xlim = numeric(),
  ylim = numeric(),
  pch = 4,
  col = "#00000060",
  type = "o",
  featureGroups = character(),
  ...
)

# S4 method for class 'XCMSnExp'
gplotFeatureGroups(
  x,
  xlim = numeric(),
  ylim = numeric(),
  pch = 4,
  col = "#00000060",
  type = "o",
  featureGroups = character(),
  ...
)

# S4 method for class 'XcmsExperiment'
gplotFeatureGroups(
  x,
  xlim = numeric(),
  ylim = numeric(),
  pch = 4,
  col = "#00000060",
  type = "o",
  featureGroups = character(),
  ...
)
Arguments
- x
An
XCMSnExporXcmsExperimentobject with feature grouping results.- xlim
numeric(2)vector of length 2 specifying retention time range. Default:numeric()(auto-calculate from data).- ylim
numeric(2)vector of length 2 specifying m/z range. Default:numeric()(auto-calculate from data).- pch
Point character for feature markers (default:
4).- col
Color for feature points and connecting lines (default:
"#00000060").- type
Plot type (default:
"o"for overplotted points and lines).- featureGroups
charactervector of feature group identifiers to plot. If empty (default), all feature groups are plotted.- ...
Additional arguments passed to geom functions.
Value
A ggplot object showing features connected by lines within each
feature group across retention time and m/z dimensions.
Details
The function:
Extracts feature definitions and their grouping information
Plots each feature as a point at (rtmed, mzmed)
Connects features within the same group with lines
Feature groups are created by
groupFeatures()which identifies features that likely represent the same compound (isotopes, adducts, etc.)
Feature groups must be present in the object before calling this function.
Run groupFeatures() first to create feature groups based on retention time,
m/z relationships, or other criteria.
See also
xcms::plotFeatureGroups() for the original xcms implementation.
Examples
library(xcmsVis)
library(xcms)
library(faahKO)
library(MsExperiment)
library(BiocParallel)
library(MsFeatures)
# Load example data
cdf_files <- dir(system.file("cdf", package = "faahKO"),
recursive = TRUE, full.names = TRUE)[1:3]
# Create XcmsExperiment and perform complete workflow
xdata <- readMsExperiment(spectraFiles = cdf_files, BPPARAM = SerialParam())
xdata <- findChromPeaks(xdata, param = CentWaveParam(), BPPARAM = SerialParam())
xdata <- groupChromPeaks(xdata, param = PeakDensityParam(
sampleGroups = rep(1, 3), minFraction = 0.5))
# Disable parallel processing to avoid warnings
register(SerialParam())
xdata <- adjustRtime(xdata, param = ObiwarpParam())
#> value 5
xdata <- groupChromPeaks(xdata, param = PeakDensityParam(
sampleGroups = rep(1, 3), minFraction = 0.5))
# Group features (identify related features like isotopes/adducts)
xdata <- groupFeatures(xdata, param = SimilarRtimeParam())
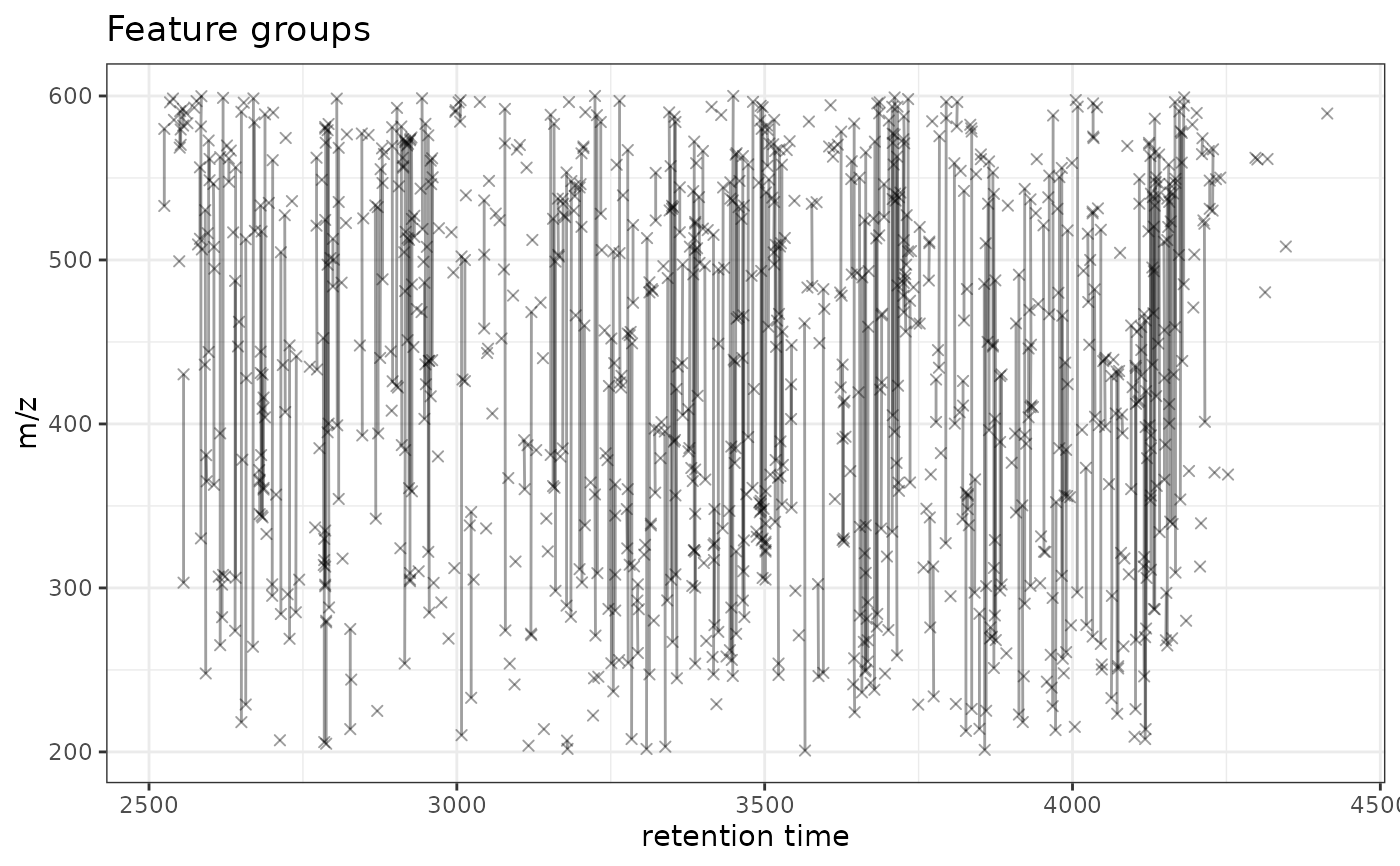
# Visualize feature groups
gplotFeatureGroups(xdata)
#> Warning: Removed 590 rows containing missing values or values outside the scale range
#> (`geom_path()`).
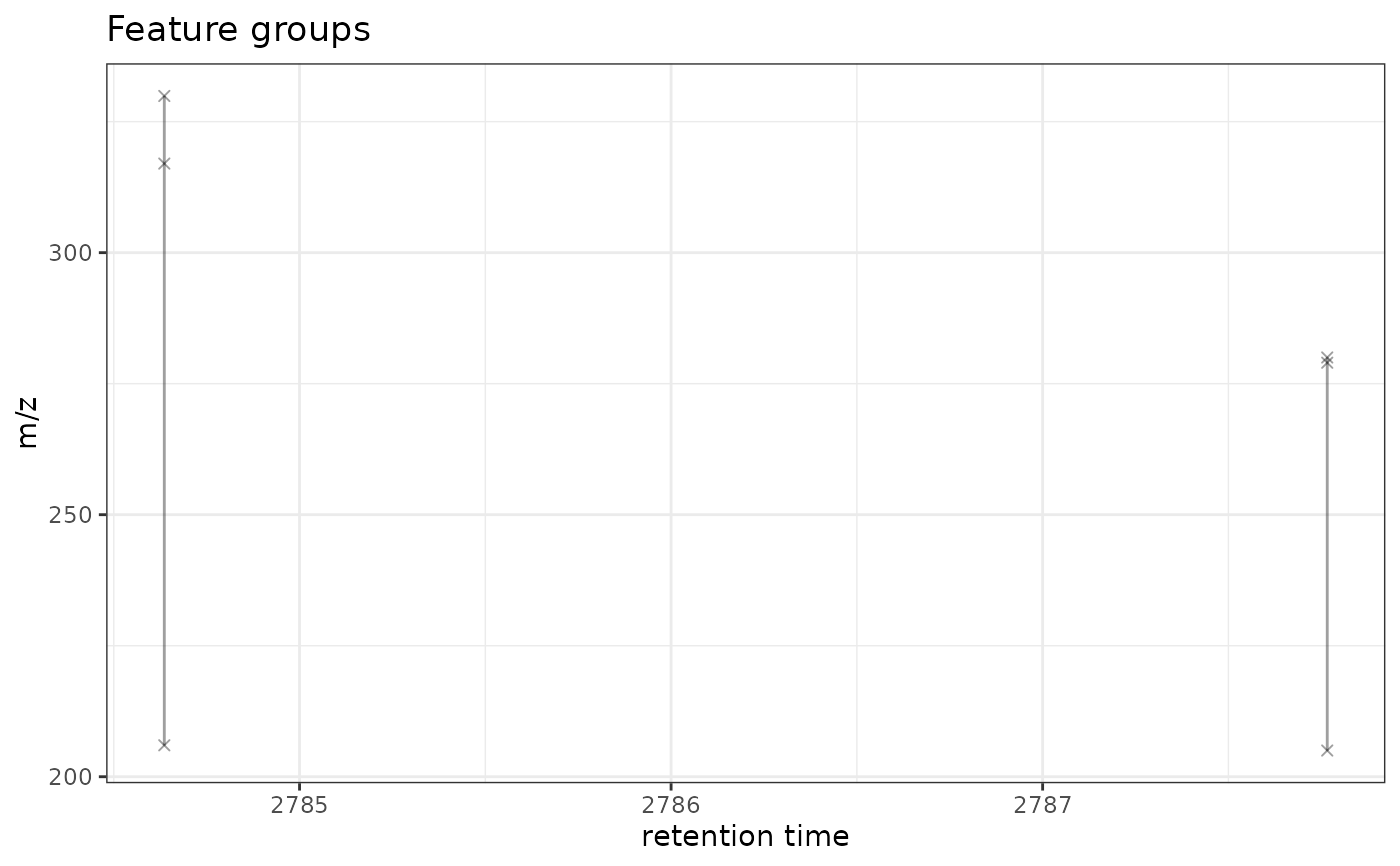
 # Visualize specific feature groups only
gplotFeatureGroups(xdata, featureGroups = c("FG.0001", "FG.0002"))
#> Warning: Removed 2 rows containing missing values or values outside the scale range
#> (`geom_path()`).
# Visualize specific feature groups only
gplotFeatureGroups(xdata, featureGroups = c("FG.0001", "FG.0002"))
#> Warning: Removed 2 rows containing missing values or values outside the scale range
#> (`geom_path()`).