ggplot2 Version of plotPrecursorIons()
Source: R/AllGenerics.R, R/gplotPrecursorIons-methods.R
gplotPrecursorIons.RdCreates a ggplot2 version of precursor ion visualization for
MsExperiment objects. This function plots the m/z and retention time of
all precursor ions in MS2 spectra, useful for visualizing DDA
(Data-Dependent Acquisition) data.
Usage
gplotPrecursorIons(object, pch = 21, col = "#00000080", bg = "#00000020", ...)

# S4 method for class 'MsExperiment'
gplotPrecursorIons(object, pch = 21, col = "#00000080", bg = "#00000020", ...)Value
A ggplot object (or list of ggplot objects if multiple files).
Use + labs() to customize axis labels and titles.
Details
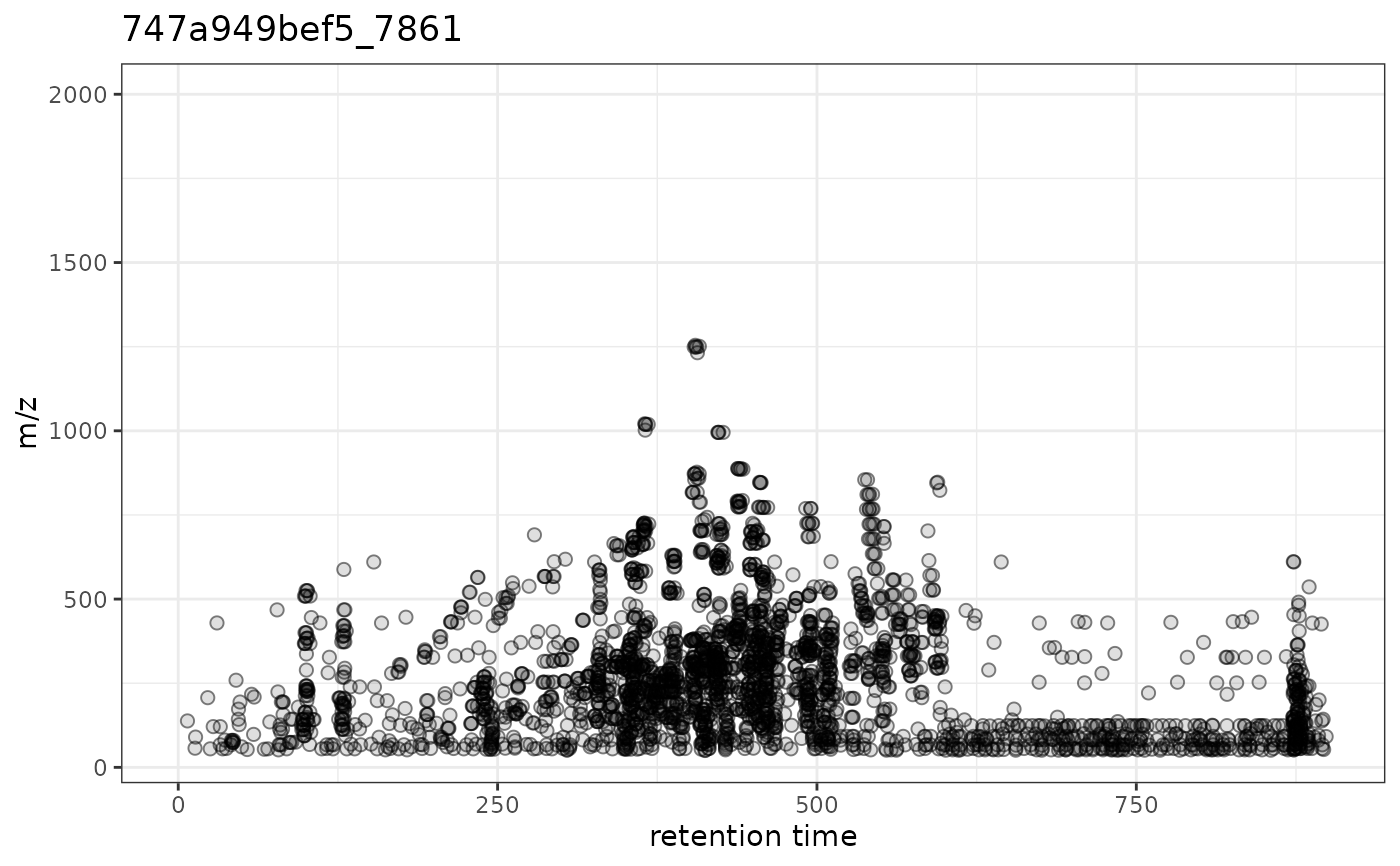
This function visualizes the precursor ions selected for fragmentation in MS/MS experiments. Each point represents a precursor ion, with:
X-axis: Retention time of the MS2 spectrum
Y-axis: Precursor m/z value
For MsExperiment objects with multiple files, separate plots are created
for each file.
The plot range includes all MS1 data to provide context, but only shows precursor ions from MS2 spectra.
Default labels are provided ("retention time", "m/z"), but can be
customized using ggplot2's labs() function, e.g.,
gplotPrecursorIons(x) + labs(x = "RT (s)").
See also
xcms::plotPrecursorIons() for the original xcms implementation.
Examples
library(xcmsVis)
library(MsExperiment)
library(ggplot2)
library(MsDataHub)
## Load a test data file with DDA LC-MS/MS data
fl <- MsDataHub::PestMix1_DDA.mzML()
#>
#> see ?MsDataHub and browseVignettes('MsDataHub') for documentation
#> downloading 1 resources
#> retrieving 1 resource
#>
#> loading from cache
pest_dda <- readMsExperiment(fl)
gplotPrecursorIons(pest_dda)
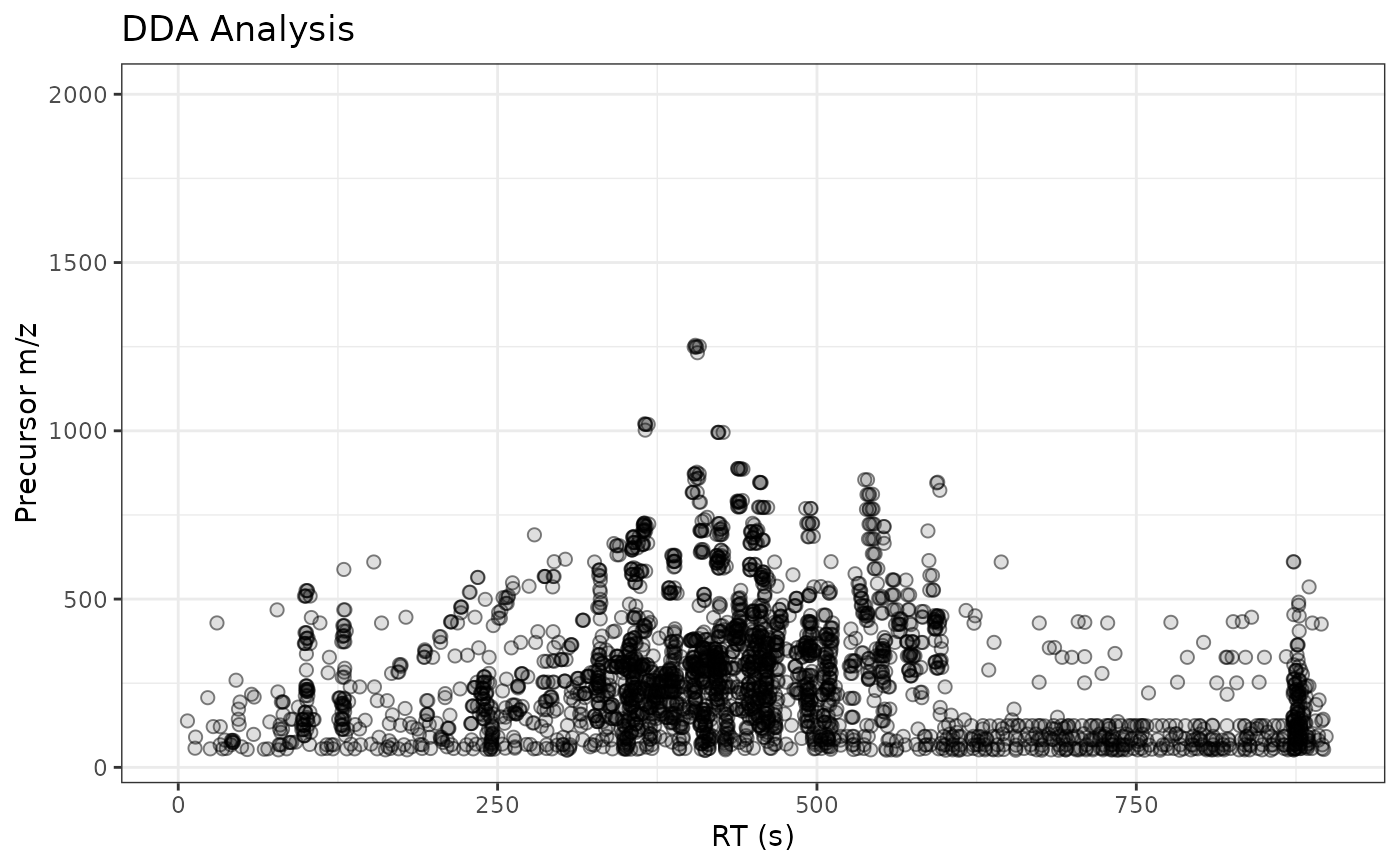
 ## Customize labels with ggplot2
gplotPrecursorIons(pest_dda) + labs(x = "RT (s)", y = "Precursor m/z",
title = "DDA Analysis")
## Customize labels with ggplot2
gplotPrecursorIons(pest_dda) + labs(x = "RT (s)", y = "Precursor m/z",
title = "DDA Analysis")
 ## Subset the data object to plot the data specifically for one or
## selected file/sample:
gplotPrecursorIons(pest_dda[1L])
## Subset the data object to plot the data specifically for one or
## selected file/sample:
gplotPrecursorIons(pest_dda[1L])