ggplot2 Version of highlightChromPeaks()
Source: R/AllGenerics.R, R/ghighlightChromPeaks-methods.R
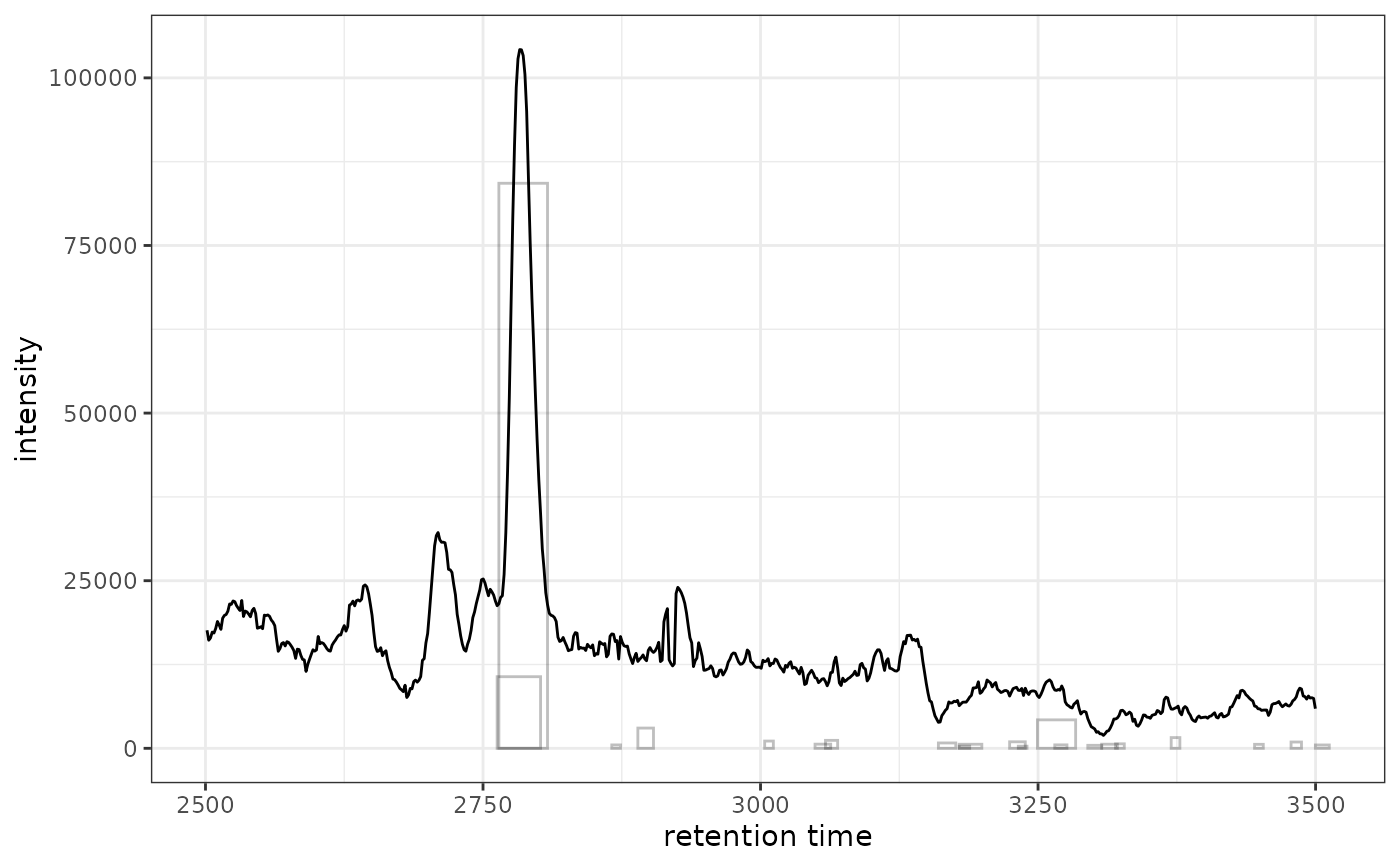
ghighlightChromPeaks.RdAdds chromatographic peak annotations to existing chromatogram plots.
This is a ggplot2 implementation that works with XCMSnExp or
XcmsExperiment objects, highlighting detected peaks with rectangles,
points, or polygons.
Usage
ghighlightChromPeaks(
  object,
  rt = numeric(),
  mz = numeric(),
  peakIds = character(),
  border = "#00000040",
  fill = NA,
  type = c("rect", "point", "polygon"),
  whichPeaks = c("any", "within", "apex_within")
)

# S4 method for class 'XCMSnExp'
ghighlightChromPeaks(
  object,
  rt = numeric(),
  mz = numeric(),
  peakIds = character(),
  border = "#00000040",
  fill = NA,
  type = c("rect", "point", "polygon"),
  whichPeaks = c("any", "within", "apex_within")
)

# S4 method for class 'XcmsExperiment'
ghighlightChromPeaks(
  object,
  rt = numeric(),
  mz = numeric(),
  peakIds = character(),
  border = "#00000040",
  fill = NA,
  type = c("rect", "point", "polygon"),
  whichPeaks = c("any", "within", "apex_within")
)
Arguments
- object
An
XCMSnExporXcmsExperimentobject with detected peaks.- rt
numeric(2)vector of length 2 specifying retention time range for peak extraction (optional).- mz
numeric(2)vector of length 2 specifying m/z range for peak extraction (optional).- peakIds
charactervector of peak identifiers (rownames fromxcms::chromPeaks()to highlight. If provided,rtandmzare ignored.- border
Color for peak borders (default: semi-transparent grey).
- fill
Color for peak fills (default:
NA).- type
character(1)specifying visualization type:"rect"(rectangle),"point"(apex point), or"polygon"(peak shape). Default:"rect".- whichPeaks
character(1)specifying peak selection:"any"(any overlap),"within"(fully contained), or"apex_within"(apex in range). Default:"any".
Details
This function returns ggplot2 layers (geoms) that can be added to an
existing chromatogram plot using the + operator. Unlike the base R
version which modifies an existing plot, this returns composable layers.
Like the original xcms::highlightChromPeaks(), this function takes the full
XCMSnExp/XcmsExperiment object and searches all peaks across all
samples, then filters by rt/mz. This means it can highlight peaks from
multiple samples. To highlight only peaks from a specific sample, filter
the object first using filterFile().
See also
xcms::highlightChromPeaks() for the original xcms implementation
Examples
library(xcmsVis)
library(xcms)
#> Loading required package: BiocParallel
#>
#> This is xcms version 4.10.0
library(faahKO)
library(MsExperiment)
#> Loading required package: ProtGenerics
#>
#> Attaching package: ‘ProtGenerics’
#> The following object is masked from ‘package:stats’:
#>
#>     smooth
library(ggplot2)

# Load and process example data
cdf_files <- system.file("cdf/KO/ko15.CDF", package = "faahKO")
xdata <- readMsExperiment(spectraFiles = cdf_files,
                          BPPARAM = BiocParallel::SerialParam())
xdata <- findChromPeaks(xdata, param = xcms::CentWaveParam(),
                        BPPARAM = BiocParallel::SerialParam())

# Extract chromatogram for plotting
chr <- chromatogram(xdata, mz = c(200, 210), rt = c(2500, 3500))
#> Extracting chromatographic data
#> Processing chromatographic peaks

# Highlight peaks from the full dataset (all samples in xdata)
gplot(chr[1, 1], peakType = "none") +
  ghighlightChromPeaks(xdata, rt = c(2500, 3500), mz = c(200, 210))


# Or filter to single sample first for cleaner visualization
xdata_filtered <- filterFile(xdata, 1)
gplot(chr[1, 1], peakType = "none") +
  ghighlightChromPeaks(xdata_filtered, rt = c(2500, 3500), mz = c(200, 210))
# Or filter to single sample first for cleaner visualization
xdata_filtered <- filterFile(xdata, 1)
gplot(chr[1, 1], peakType = "none") +
ghighlightChromPeaks(xdata_filtered, rt = c(2500, 3500), mz = c(200, 210))