ggplot2 Version of plotChromatogramsOverlay()
Source: R/AllGenerics.R, R/gplotChromatogramsOverlay-methods.R
gplotChromatogramsOverlay.RdCreates overlay plots of multiple chromatograms, with one plot per row in
the XChromatograms or MChromatograms object. Each plot overlays all
samples (columns) for that m/z slice (row). This is a ggplot2
implementation of XCMS's xcms::plotChromatogramsOverlay() function,
enabling modern visualization and interactive plotting capabilities.
Usage
gplotChromatogramsOverlay(
  object,
  col = "#00000060",
  type = "l",
  main = NULL,
  xlim = numeric(),
  ylim = numeric(),
  peakType = c("polygon", "point", "rectangle", "none"),
  peakBg = NULL,
  peakCol = NULL,
  peakPch = 1,
  stacked = 0,
  transform = identity,
  ...
)

# S4 method for class 'XChromatograms'
gplotChromatogramsOverlay(
  object,
  col = "#00000060",
  type = "l",
  main = NULL,
  xlim = numeric(),
  ylim = numeric(),
  peakType = c("polygon", "point", "rectangle", "none"),
  peakBg = NULL,
  peakCol = NULL,
  peakPch = 1,
  stacked = 0,
  transform = identity,
  ...
)

# S4 method for class 'MChromatograms'
gplotChromatogramsOverlay(
  object,
  col = "#00000060",
  type = "l",
  main = NULL,
  xlim = numeric(),
  ylim = numeric(),
  peakType = c("polygon", "point", "rectangle", "none"),
  peakBg = NULL,
  peakCol = NULL,
  peakPch = 1,
  stacked = 0,
  transform = identity,
  ...
)
Arguments
- object
An
XChromatogramsorMChromatogramsobject.- col
Color for the chromatogram lines (default:
"#00000060").- type
Plot type (default:
"l"for line).- main
charactervector of panel titles, one per row. IfNULL(default), no titles are used. If length 1, the same title is used for all panels. Use+ labs()for ggplot2-style customization.- xlim
numeric(2)vector of length 2 specifying retention time range. Default:numeric()(auto-calculate). Use+ labs()to customize axis labels and titles.- ylim
numeric(2)vector of length 2 specifying intensity range. Default:numeric()(auto-calculate).- peakType
character(1)defining the type of peak annotation:"polygon","point","rectangle", or"none"(default:"polygon").- peakBg
Background color for peak markers (default:
NULL, usespeakColwith transparency).- peakCol
Color for peak markers (default:
NULL, usescol).- peakPch
Point character for peak markers when
peakType = "point"(default:1).- stacked
Numeric value for stacking offset. If > 0, chromatograms will be offset vertically by this amount for visual separation (default:
0).- transform
Function to transform intensity values (default:
identity). Useful for log-transformations or other intensity scaling.- ...
Additional arguments (for compatibility).
Value
If the object has one row: a single ggplot object. If the object has
multiple rows: a patchwork object combining multiple ggplot objects.
Details
This function creates overlay plots where all samples (columns) in a given m/z slice (row) are overlaid in a single plot. If the object contains multiple rows, each row gets its own panel stacked vertically using patchwork.
The function differs from gplot() for XChromatograms in that:
It explicitly handles multiple rows (whereas
gplot()warns and uses only the first)It supports
stackedparameter for vertical offsetIt supports
transformparameter for intensity transformations
See also
xcms::plotChromatogramsOverlay() for the original xcms implementation or
gplot() for single-row overlay plots
Examples
library(xcmsVis)
library(xcms)
library(faahKO)
library(MsExperiment)
library(BiocParallel)
# Load example data
cdf_files <- dir(system.file("cdf", package = "faahKO"),
recursive = TRUE, full.names = TRUE)[1:3]
# Create XcmsExperiment and perform peak detection
xdata <- readMsExperiment(spectraFiles = cdf_files, BPPARAM = SerialParam())
cwp <- CentWaveParam(peakwidth = c(20, 80), ppm = 25)
xdata <- findChromPeaks(xdata, param = cwp, BPPARAM = SerialParam())
# Extract chromatograms for multiple m/z ranges
chr <- chromatogram(xdata, mz = rbind(c(305.05, 305.15), c(344.0, 344.2)))
#> Extracting chromatographic data
#> Processing chromatographic peaks
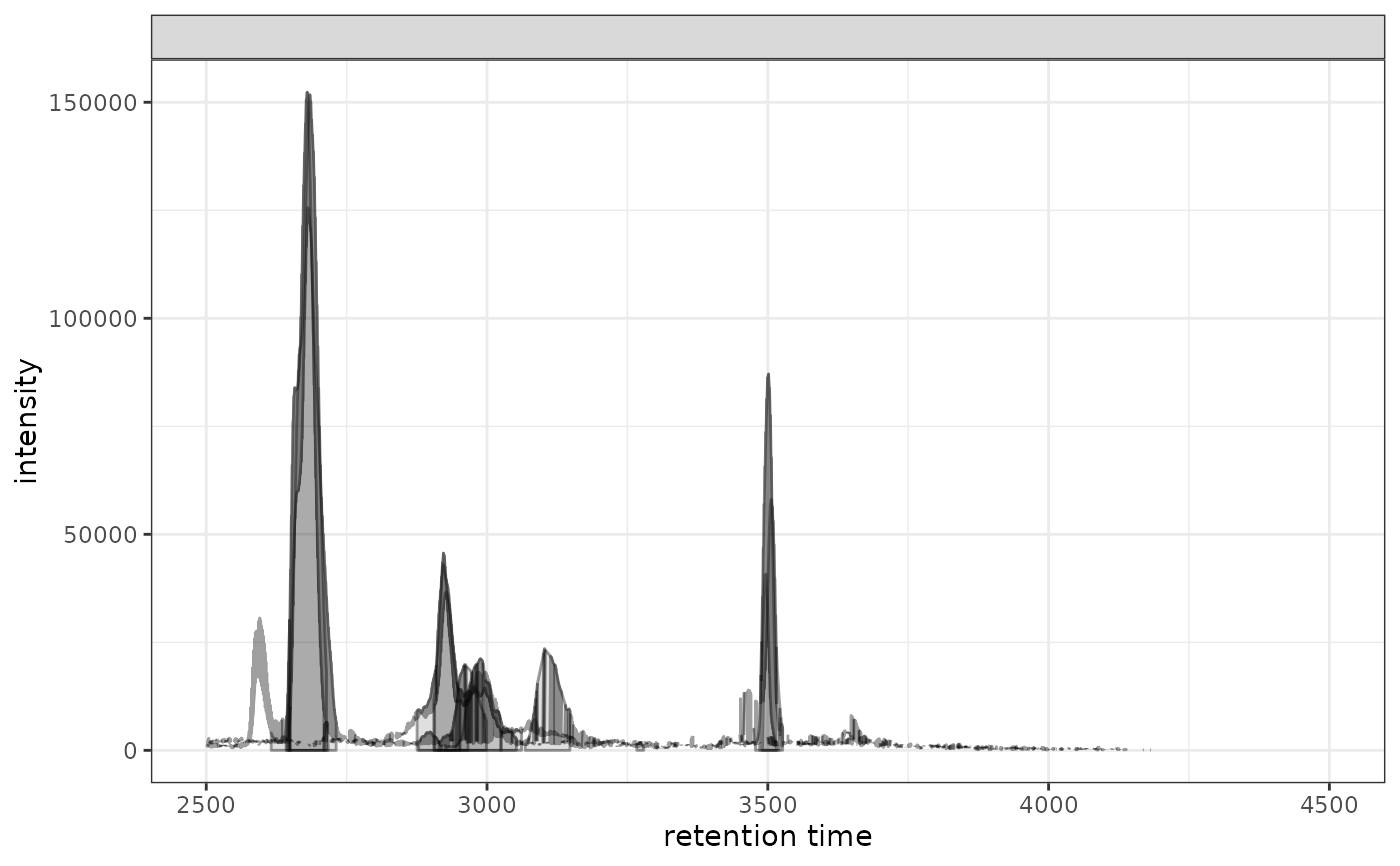
# Create overlay plot for all rows
gplotChromatogramsOverlay(chr)
#> Warning: Removed 260 rows containing missing values or values outside the scale range
#> (`geom_line()`).
 # With stacked offset for visual separation
gplotChromatogramsOverlay(chr, stacked = 1e6)
#> Warning: Removed 260 rows containing missing values or values outside the scale range
#> (`geom_line()`).
# With stacked offset for visual separation
gplotChromatogramsOverlay(chr, stacked = 1e6)
#> Warning: Removed 260 rows containing missing values or values outside the scale range
#> (`geom_line()`).
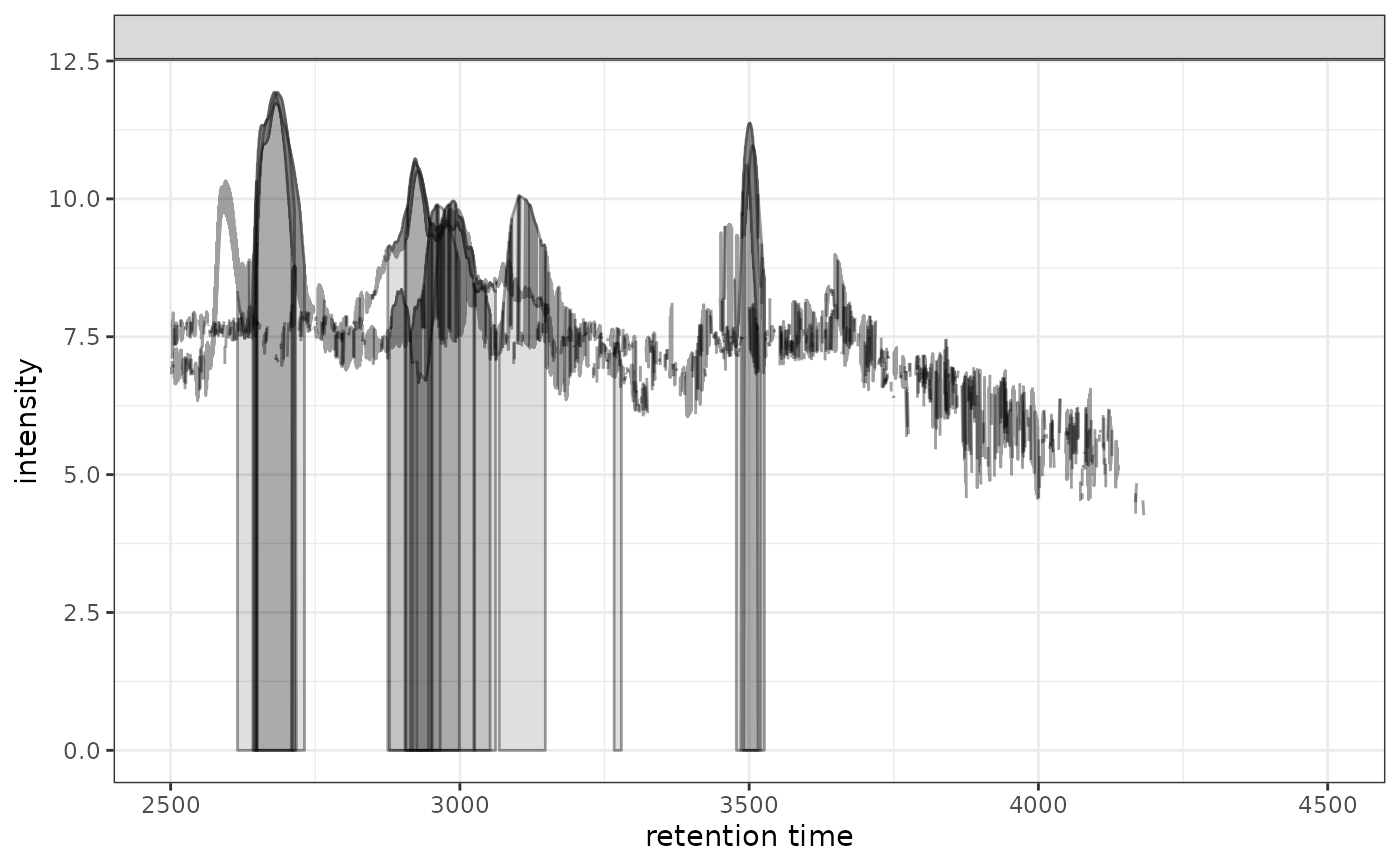
 # With log transformation
gplotChromatogramsOverlay(chr, transform = log1p)
#> Warning: Removed 260 rows containing missing values or values outside the scale range
#> (`geom_line()`).
# With log transformation
gplotChromatogramsOverlay(chr, transform = log1p)
#> Warning: Removed 260 rows containing missing values or values outside the scale range
#> (`geom_line()`).