3 Which image format for which purpose?
3.1 Introduction
Choosing the right image format is critical for scientific publications. Use the wrong format and your beautifully crafted plots will look pixelated, text will be blurry, and file sizes will balloon unnecessarily. This chapter explains the fundamental difference between raster and vector graphics, and provides a decision tree for choosing the optimal format for every situation.
Learning Objectives
By the end of this chapter, you will:
- Understand the fundamental difference between raster and vector graphics
- Know when to use PNG, TIFF, PDF, SVG, and EPS formats
- Understand DPI requirements for different publication contexts
- Learn why you should never use JPEG for scientific figures
- Be able to choose the optimal format based on content type (plots vs. photographs)
- Know how to set appropriate resolution settings in R
3.2 What is a Raster Image?
Raster graphics are grids of colored pixels
- Stores individual pixel colors: RGB(255, 128, 64)
- Fixed resolution measured in DPI (Dots Per Inch)
- More pixels = higher resolution = larger file size
- Cannot be scaled up without quality loss

Image: Wikimedia Commons (2006)
3.3 What is a Vector Image?
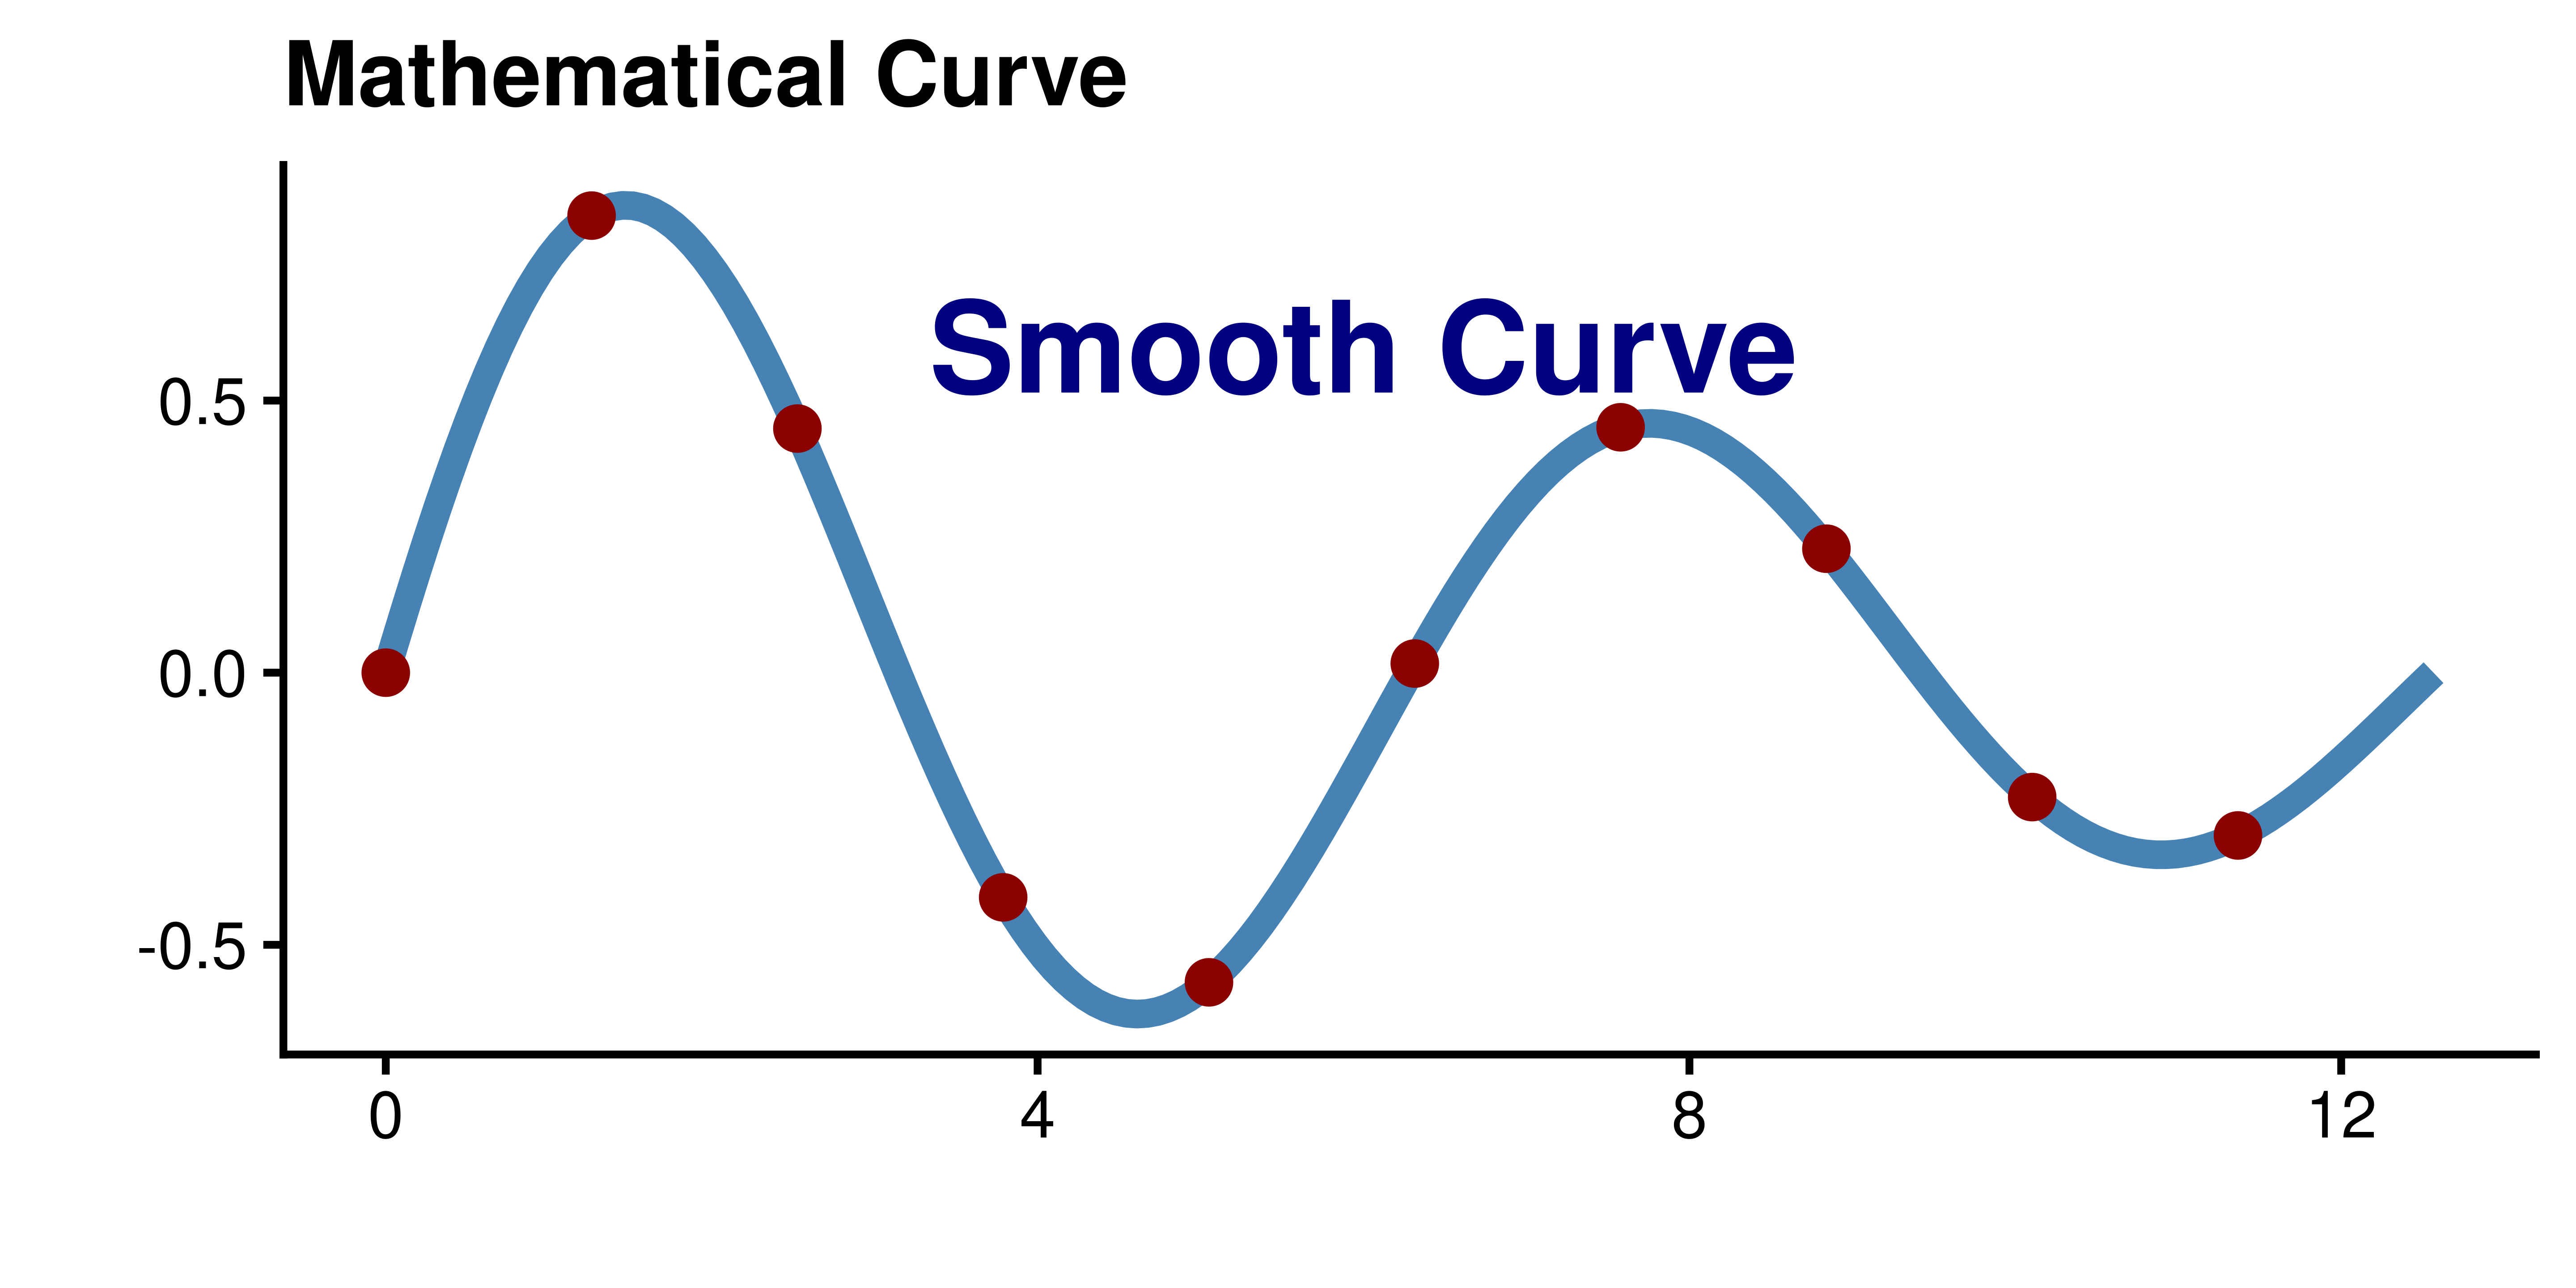
Vector graphics use mathematical descriptions
- Mathematical formulas define shapes and lines
- “Draw a line from point (0,0) to (10,10)”
- “Create a circle with center (5,5) and radius 3”
- Infinitely scalable without quality loss
Infinite Resolution
Because vectors are mathematical formulas, they can be scaled to any size without losing quality. The curve is defined by equations, not pixels!

3.4 Vector vs. Raster Comparison
3.5 Vector vs. Raster Comparison (2)

| Aspect | Vector (PDF, SVG, EPS) | Raster (PNG, TIFF, JPG) |
|---|---|---|
| Definition | Mathematical formulas | Grid of pixels |
| Scalability | Infinite resolution | Fixed resolution (DPI) |
| File Size | Small (formulas compact) | Large (all pixels stored) |
| Best For | Plots, diagrams, text, screenshots of websites | Photos, screenshots |
| Editability | Easy to edit paths | Pixel-level editing only |
| Text Quality | Always crisp | Can become blurry |
3.6 Container Formats: PDF and TIFF
PDF and TIFF are Containers!
Both PDF and TIFF can contain EITHER vector OR raster data:
- PDF: Can contain vector graphics, raster images, or both
- TIFF: Usually raster, but can embed vector data
TIFF Compression Options:
| Type | Description | Use Case |
|---|---|---|
| Uncompressed | No compression (huge files) | Archival |
| LZW | Lossless compression | Publications |
| ZIP | Lossless compression | Publications |
| JPEG | Lossy compression | Web (avoid for science) |
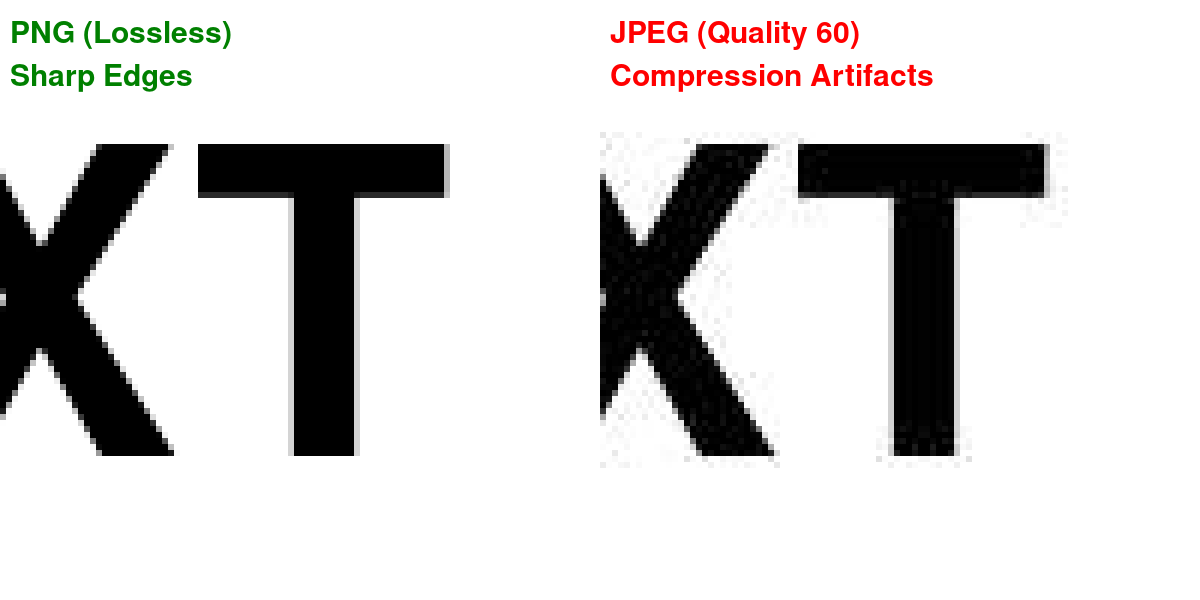
3.7 JPEG Compression Artifacts
3.8 Format Properties Comparison
| Format | Type | Compression | Container? | Notes |
|---|---|---|---|---|
| Vector + Raster | Lossless | Yes | Can embed both vector and raster data | |
| EPS | Vector | Lossless | Yes | Older format required by some journals. Use device = "eps" in ggsave(). PDF is preferred when accepted. |
| SVG | Vector | Lossless | No | XML-based, web-native |
| PNG | Raster | Lossless | No | Supports transparency |
| TIFF | Raster | Lossless or Lossy | Yes | Multiple pages, various compression options |
| JPEG | Raster | Lossy | No | Best for photos only |
| WebP | Raster | Lossless or Lossy | No | Modern web format, smaller than PNG/JPEG |
Container Formats
Container formats can hold multiple types of data or multiple images:
- PDF: Can mix vector graphics, raster images, fonts, and text
- EPS: Can embed fonts, preview images, and vector data
- TIFF: Can contain multiple pages/images with different compression
Non-container formats store a single image with one encoding type.
3.9 File Format Comparison
`geom_smooth()` using formula = 'y ~ x'
`geom_smooth()` using formula = 'y ~ x'
`geom_smooth()` using formula = 'y ~ x'
`geom_smooth()` using formula = 'y ~ x'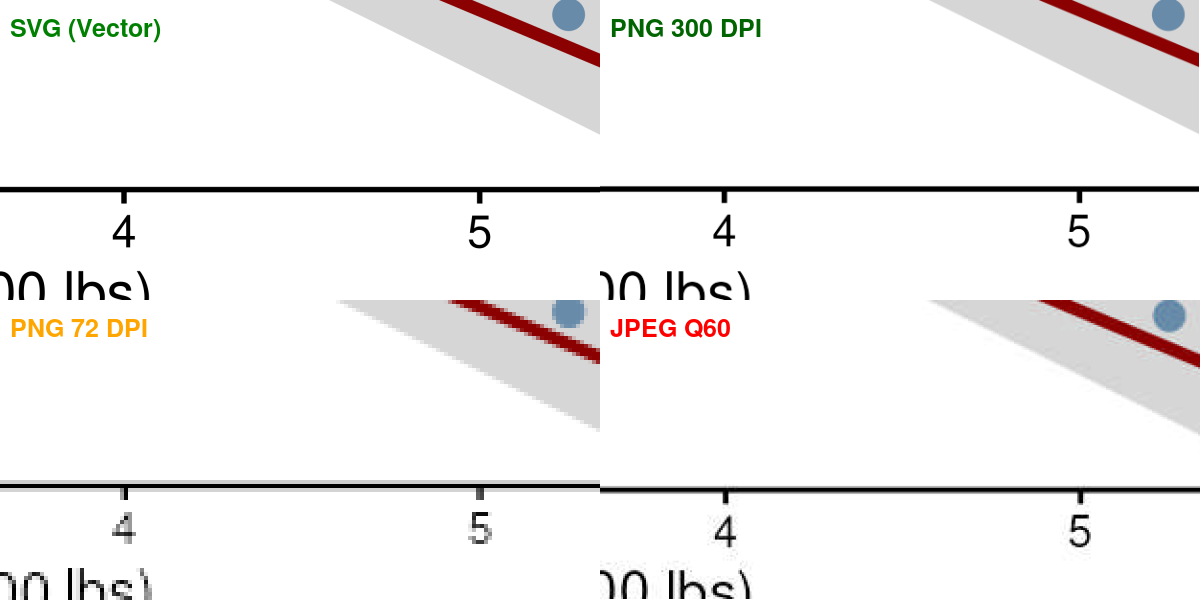
3.10 Real world horror story
This is the graphical abstract
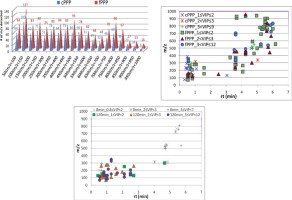
Figure from Barri et al. (2012)
This was one of the figures
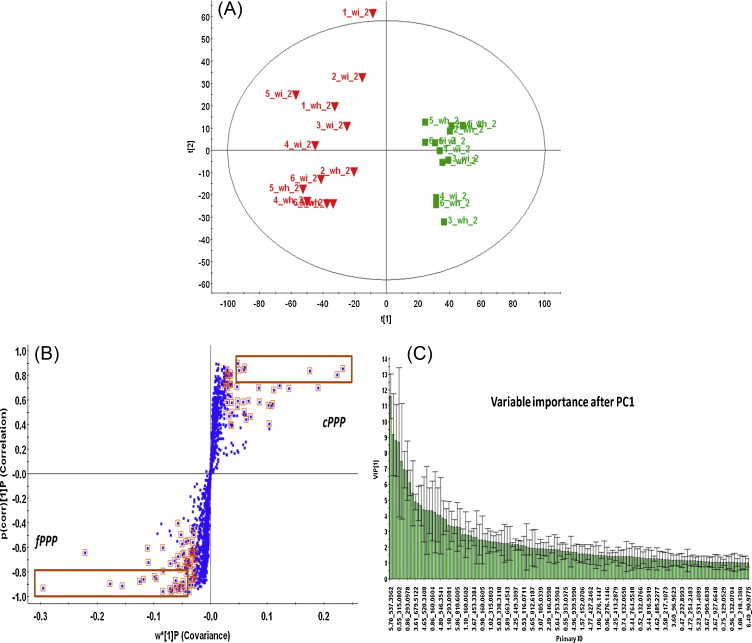
Figure from Barri et al. (2012)
Barri et al. (2012)
3.11 Vector Screenshots from Websites
Capturing Website Content as Vector Graphics
Print to PDF as you see the website
- Open the webpage in Google Chrome
- Open Chrome DevTools (
F12) - Click “⋮”
- Click “More Tools”
- click “Rendering”
- Set “Emulate CSS media type” to “screen”
- “Print”to PDF
Why This Matters
- Text stays crisp - Perfect for including web-based figures
- Smaller file size - Vector PDF is compact
- Editable - Can extract or edit elements in PDF editor
- Publication quality - No pixelation when zoomed
Examples:
- Document online data visualization examples
- Include web-based tools in presentations and papers
3.12 Format Selection: Decision Tree
%%{init: {'theme':'dark', 'themeVariables': {'edgeLabelBackground':'#1a1a1a', 'primaryTextColor':'#fff', 'secondaryTextColor':'#fff', 'tertiaryTextColor':'#fff'}}}%%

flowchart LR
    A[What type of image?] --> B{Photo}
    A --> C{Screenshot}
    A --> D{Generated figure/<br/>website snapshot}

    B --> B1{Where will it<br/>be used?}
    B1 -->|Publication| B2[TIFF LZW<br/>300+ DPI]
    B1 -->|Presentation/Web| B3[JPEG/WebP <br/> 150+ DPI]

    C --> C1{Where will it<br/>be used?}
    C1 -->|Publication| C2[TIFF LZW<br/>300+ DPI]
    C1 -->|Presentation/Web| C3[PNG<br/>150 DPI]

    D --> D1{Publication or<br/>presentation?}
    D1 -->|Publication| D2{Vector support?}
    D1 -->|Presentation/Web| D3[SVG or PNG]

    D2 -->|Yes| D4[PDF / SVG / EPS<br/>All equivalent vectors]
    D2 -->|No| D5[TIFF 600+ DPI LZW<br/>PNG not supported]

    style A fill:#5dade2,color:#fff
    style B fill:#5dade2,color:#fff
    style C fill:#5dade2,color:#fff
    style D fill:#5dade2,color:#fff
    style B1 fill:#5dade2,color:#fff
    style C1 fill:#5dade2,color:#fff
    style D1 fill:#5dade2,color:#fff
    style D2 fill:#5dade2,color:#fff
    style D4 fill:#2ecc71,color:#fff
    style D5 fill:#5dade2,color:#fff
    style D3 fill:#9b59b6,color:#fff
    style B2 fill:#3498db,color:#fff
    style B3 fill:#e74c3c,color:#fff
    style C2 fill:#3498db,color:#fff
    style C3 fill:#9b59b6,color:#fff
3.13 Last notes
- Make sure that any art you include is vector based!
- Composing your figures in Powerpoint is OK - but use high quality source-material
- BioRender material is typically vector based
3.14 Summary
Key Takeaways
- Vector for plots - use PDF/SVG for R-generated plots with text and lines
- Raster for photos - use PNG/TIFF at ≥300 DPI for photographs and microscopy
- Never use JPEG for scientific figures - lossy compression degrades quality
- DPI requirements:
- Print publications: 300-600 DPI
- Presentations: 150 DPI is sufficient
- Web/screen: 72-96 DPI
- Format by destination:
- Journal submission: PDF or TIFF
- Presentations: PNG (smaller files)
- Web: SVG (scalable) or PNG
- Hybrid figures: Use vector for plots + high-res raster for photographs
- Check journal requirements - some prefer TIFF, others accept PDF
- Use appropriate ggsave() settings:
device,dpi,width,height
3.15 Exercises
Try It Yourself
Create a simple ggplot and save it in 4 formats:
p <- ggplot(mtcars, aes(mpg, hp)) + geom_point()
ggsave("plot.pdf", p, width = 6, height = 4)
ggsave("plot.svg", p, width = 6, height = 4)
ggsave("plot.png", p, width = 6, height = 4, dpi = 300)
ggsave("plot_low.png", p, width = 6, height = 4, dpi = 72)
Open each file and zoom in to compare:
- Which formats remain sharp at any zoom level?
- Which show pixelation?
- Compare file sizes
Try saving a figure with a photograph embedded (use
annotation_raster())Practice using the decision tree to choose formats for different scenarios
3.16 Further Reading
- R Graphics Cookbook - Output to Files - comprehensive guide to saving plots
- Understanding DPI and resolution - technical background
- SVG vs PNG comparison - visual examples
- Journal figure guidelines database - PMC requirements